Posts

Showing posts with the label ML

Generative vs. Discriminative Models: Key Differences in Machine Learning

Machine learning has become a cornerstone of modern technology, enabling computers to learn and make predictions even for unseen data. At its core, machine learning is a convergence of ideas from Artificial Intelligence (AI), pattern recognition, and related technologies. This transformative field allows machines to learn from data without being explicitly programmed for specific tasks. Through its algorithms—such as Logistic Regression and Naive Bayes—it powers applications ranging from voice recognition to data mining, with accuracy improving over time. Among the many facets of machine learning, one critical distinction lies in the type of model employed: generative models and discriminative models . These models address different aspects of learning and prediction and offer unique advantages depending on the task at hand. Learning Objectives Grasp the fundamental concepts of discriminative and generative models. Understand the differences between these models and when...

Understanding Bias and Variance in Machine Learning

Image
Bias and Variance: Understanding the Trade-off In machine learning and statistical modeling, two key sources of error are bias and variance . These two concepts describe the error that a model makes due to its assumptions about the data and its sensitivity to variations in the data. Understanding the bias-variance trade-off is crucial in building effective machine learning models. In this article, we will explore bias and variance in detail, their mathematical foundations, and the trade-off between them that every data scientist must manage to build accurate models. What is Bias? Bias refers to the error introduced by the assumptions made by a model in its learning process. A high bias means that the model makes strong assumptions and oversimplifies the underlying data, leading to systematic errors or inaccuracies in predictions. On the other hand, a model with low bias has fewer assumptions and tries to capture the complexity of the data. ...

Starting Your First Data Science Project? Here are 10 Things You Must Absolutely Know

Starting Your First Data Science Project? Here are 10 Things You Must Absolutely Know Embarking on your first data science project can be overwhelming, but it doesn't have to be. Whether you're a beginner looking to dive into the world of data science or an experienced professional starting your first real-world project, there are key things you must absolutely know to set yourself up for success. In this article, we’ll cover the 10 essential steps and tips that will help guide you through your first data science project and ensure you create a meaningful and successful outcome. 1. Understand the Problem You're Trying to Solve Before diving into any project, it is absolutely crucial to have a clear understanding of the problem you're trying to solve. Often, new data scientists jump straight into analyzing data without fully comprehending the business or research objectives behind the data. A lack of understanding can lead to conf...

Understanding DBSCAN in Machine Learning

Understanding DBSCAN in Machine Learning In this article, we will explore DBSCAN (Density-Based Spatial Clustering of Applications with Noise), a powerful and versatile clustering algorithm. DBSCAN is used in machine learning and data science to identify clusters in data, especially when the data includes noise and varying densities. This article will cover the theoretical foundations of DBSCAN, its strengths, its limitations, how to implement it using Python, and best practices for parameter selection. By the end of this article, you'll have a thorough understanding of DBSCAN and how it can be applied to various real-world datasets. What is DBSCAN? DBSCAN stands for Density-Based Spatial Clustering of Applications with Noise . It is a density-based clustering algorithm that groups points based on the density of data points around them. This clustering algorithm was first proposed by Martin Ester, Hans-Peter Kriegel, Jörg Sander,...

Random Forest Algorithm

Image
Understanding Random Forest in Machine Learning In this article, we will dive into Random Forest, one of the most popular machine learning algorithms. We’ll explore how it works, its advantages, and hands-on implementations using Python for both classification and regression tasks. By the end, you’ll understand why Random Forest is a go-to algorithm for many machine learning problems. What is Random Forest? Random Forest is an ensemble learning algorithm that builds multiple decision trees and combines their outputs to improve accuracy and reduce overfitting. It is versatile and can be used for both classification and regression tasks. Random Forest creates a "forest" of decision trees, where each tree is trained on a random subset of the data and features. The final prediction is made by aggregating the outputs of all the trees (majority vote for classification or averaging for regression). Why is it Called ...

Decision Trees Algorithm

Image
Understanding Decision Trees in Supervised Learning In this article, we will explore decision trees, an important concept in supervised learning. We will cover everything from the basics of decision trees to more advanced topics like entropy, information gain, and when to stop splitting. By the end, you’ll have a solid understanding of how decision trees work and how to implement them using Python. What is a Decision Tree? A decision tree is a model used for classification and regression tasks. It splits the data into different branches based on specific rules derived from the features. The tree starts at the top (root node) and splits into branches (decision nodes) based on feature values, eventually leading to leaf nodes where the outcome or prediction is made. Types of Decision Tree Decision trees can be categorized into two types: Classification Trees: Used when the output variable is categorical. For example, pre...

Understanding Cross-Validation in Machine Learning

Image
Understanding Cross-Validation in Machine Learning Introduction Cross-validation is a powerful technique used in machine learning to assess the performance of a model. It is an essential tool to estimate how well a model will generalize to unseen data. The goal of cross-validation is to prevent issues like overfitting and underfitting by evaluating a model on multiple subsets of the data. In this article, we will explore. What is Cross-Validation: Defines cross-validation and its role in model evaluation. Types of Cross-Validation: Describes various methods like K-Fold, Stratified K-Fold, LOOCV, and Time Series Cross-Validation. How Cross-Validation Works: Provides steps of the process. Python Code Example: Illustrates how to use KFold and cross_val_score from scikit-learn to perform cross-validation. Advantages of Cross-Validation: Lists the benefits of using cross-validation. Conclusion: Summarizes the importance of cross-vali...

Understanding the Confusion Matrix in Machine Learning

Image
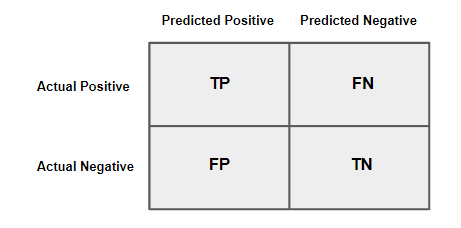
Understanding the Confusion Matrix in Machine Learning Introduction In machine learning, classification models are commonly used to predict labels for data points. One of the most effective ways to evaluate the performance of a classification model is through a Confusion Matrix . The confusion matrix provides insight into not only the overall accuracy of the model but also the types of errors made. In this article, we will explain the confusion matrix in detail, discuss its significance, and provide a Python code example along with a visual representation. What is a Confusion Matrix? A confusion matrix is a table that summarizes the performance of a classification model. It compares the actual labels with the predicted labels generated by the model, helping us visualize how well the model is performing. The confusion matrix is structured as a 2x2 (or larger) table for binary (or multiclass) classification tasks, where: ...

Machine Learning Metrics

Machine Learning Metrics: Precision and More Introduction Machine learning models need to be evaluated to understand how well they perform on tasks such as classification, regression, or clustering. Various evaluation metrics are used to gauge the effectiveness of these models. One of the most important metrics in classification tasks is Precision , but other key metrics include Accuracy, Recall, F1-Score, and more . This article covers these below metrics in detail, focusing on their significance in machine learning. Precision Recall Accuracy F1-Score ROC-AUC Logarithmic Loss Precision Precision is a metric used in classification tasks to measure how many of the positive predictions made by the model are actually correct. It answers the question: "Out of all the instances the model predicted as positive, how many were truly positive?" It is defined as: Precision = True Positives / ...

Support Vector Machine (SVM) Algorithm

Support Vector Machine Tutorial Support Vector Machine (SVM) is a supervised machine learning algorithm that can be used for both classification and regression challenges. However, it is mostly used in classification problems. 1. Introduction to Support Vector Machine Definition: SVM is a powerful classification method that works by finding the hyperplane that best divides a dataset into classes. In two-dimensional space, this hyperplane is simply a line. Applications: Image classification. Handwriting recognition. Bioinformatics, such as protein classification. 2. Key Concepts Hyperplane: In SVM, a hyperplane is a decision boundary that separates data points of different classes. The best hyperplane is the one that maximizes the margin between the classes. Margin: The margin is the distance between the hyperplane and the nearest data points from either class, known as support vectors. SVM aims to maximize this margin....

Linear Regression Algorithm

Linear Regression Tutorial Linear regression is a fundamental statistical method used for understanding the relationship between a dependent variable and one or more independent variables. It is widely used for predictive analysis and machine learning tasks. 1. Introduction to Linear Regression Definition: Linear regression is a linear approach to modeling the relationship between a dependent variable \( Y \) and one or more independent variables \( X \). When there is only one independent variable, it is called simple linear regression, and when there are multiple independent variables, it is called multiple linear regression. Applications: Predicting house prices based on features like size, location, and number of bedrooms. Forecasting sales based on past sales data and marketing spend. Determining the relationship between temperature and energy consumption. 2. Key Concepts Linear Relationship: The core idea of linear ...

Logistic Regression Algorithm for Beginners

Logistic Regression Tutorial Logistic Regression Algorithm for Beginners Logistic regression is a popular statistical method for analyzing datasets in which there are one or more independent variables that determine an outcome. The outcome is usually binary, meaning it has two possible values such as yes/no, true/false, or 0/1. 1. Introduction to Logistic Regression Definition: Logistic regression is a classification algorithm used to assign observations to a discrete set of classes. It is a predictive analysis algorithm and based on the concept of probability. Applications: Predicting whether an email is spam or not. Determining if a transaction is fraudulent. Diagnosing a disease as present or absent. 2. Key Concepts Odds and Probability: Probability is the measure of the likelihood that an event will occur. Odds is the ratio of the probability of an event happening to the probability of it not happening. ...