Understanding the Confusion Matrix in Machine Learning
Introduction
In machine learning, classification models are commonly used to predict labels for data points. One of the most effective ways to evaluate the performance of a classification model is through a Confusion Matrix. The confusion matrix provides insight into not only the overall accuracy of the model but also the types of errors made. In this article, we will explain the confusion matrix in detail, discuss its significance, and provide a Python code example along with a visual representation.
What is a Confusion Matrix?
A confusion matrix is a table that summarizes the performance of a classification model. It compares the actual labels with the predicted labels generated by the model, helping us visualize how well the model is performing.
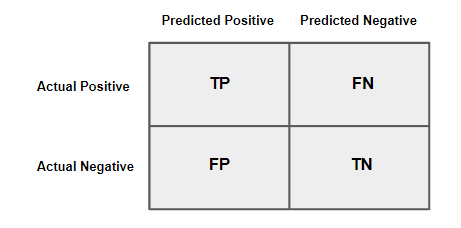
The confusion matrix is structured as a 2x2 (or larger) table for binary (or multiclass) classification tasks, where:
- True Positive (TP): The model correctly predicted the positive class.
- True Negative (TN): The model correctly predicted the negative class.
- False Positive (FP): The model incorrectly predicted the positive class when it was actually negative (also known as a Type I error).
- False Negative (FN): The model incorrectly predicted the negative class when it was actually positive (also known as a Type II error).
Confusion Matrix Structure (Binary Classification)
The confusion matrix for binary classification looks like this:
Each of these metrics can be used to calculate additional evaluation metrics like precision, recall, and accuracy.
Metrics Derived from the Confusion Matrix
Several key evaluation metrics can be calculated from the values in a confusion matrix. These include:
1. Accuracy
Accuracy measures the overall correctness of the model. It is defined as:
Accuracy = (TP + TN) / (TP + TN + FP + FN)
2. Precision
Precision measures how many of the positive predictions were correct. It is defined as:
Precision = TP / (TP + FP)
3. Recall (Sensitivity)
Recall measures how well the model identifies positive instances. It is defined as:
Recall = TP / (TP + FN)
4. F1-Score
The F1-Score is the harmonic mean of precision and recall, providing a balanced metric for imbalanced datasets. It is defined as:
F1-Score = 2 * (Precision * Recall) / (Precision + Recall)
Code Example
Below is a Python code example using the scikit-learn library to compute the confusion matrix, as well as precision, recall, and other metrics.
# Import necessary libraries
from sklearn.metrics import confusion_matrix, classification_report
from sklearn.model_selection import train_test_split
from sklearn.datasets import load_iris
from sklearn.ensemble import RandomForestClassifier
import seaborn as sns
import matplotlib.pyplot as plt

# Load a sample dataset
data = load_iris()
X = data.data
y = data.target

# Split the dataset into training and testing sets
X_train, X_test, y_train, y_test = train_test_split(X, y, test_size=0.2, random_state=42)

# Train a classifier
classifier = RandomForestClassifier()
classifier.fit(X_train, y_train)

# Make predictions
y_pred = classifier.predict(X_test)

# Compute confusion matrix
conf_matrix = confusion_matrix(y_test, y_pred)

# Display the confusion matrix
sns.heatmap(conf_matrix, annot=True, fmt="d", cmap="Blues", xticklabels=data.target_names, yticklabels=data.target_names)
plt.xlabel('Predicted')
plt.ylabel('Actual')
plt.title('Confusion Matrix')
plt.show()

# Classification report for precision, recall, and F1-score
print(classification_report(y_test, y_pred, target_names=data.target_names))
Confusion Matrix Output
Below is the output image of the confusion matrix generated from the code above:

Conclusion
The confusion matrix is a fundamental tool in machine learning that helps evaluate the performance of classification models. It provides detailed insights into the types of errors the model is making, and from the confusion matrix, other important metrics such as precision, recall, and F1-score can be calculated. Understanding and interpreting the confusion matrix is crucial to improving model performance and addressing any potential shortcomings in classification tasks.


Comments
Post a Comment